Customizable SEO Dashboards: Unify Rankings & AI Tracking
Build customizable SEO dashboards to track traditional rankings & AI visibility. Get 2026 metrics, templates & a framework for unified GEO measurement.

Customizable SEO Dashboards in the Age of AI Retrieval
May, 2026
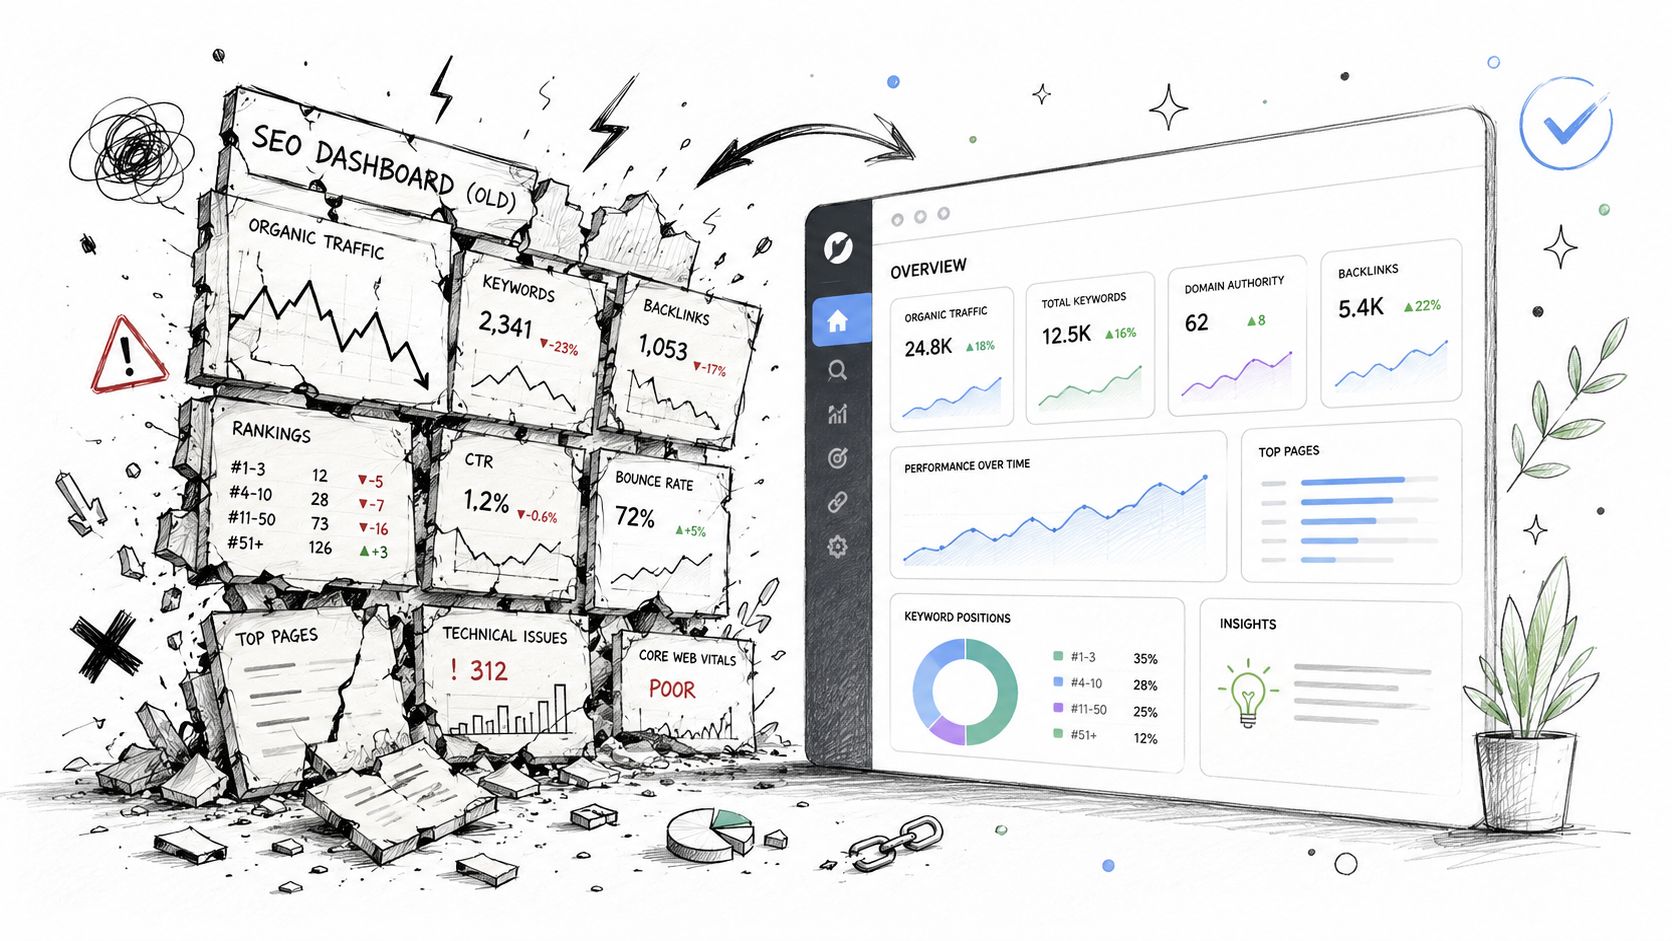
Conventional SEO dashboards became more advanced just as they became incomplete. The modern dashboard solved one problem by centralizing Google Search Console, Google Analytics 4, and tools like Ahrefs or SEMrush into a single interactive view, replacing static monthly PDFs with always-on monitoring, as noted by Data Bloo on custom SEO dashboards. But that same architecture still assumes visibility is earned only in ranked links.
That assumption no longer holds.
Enterprise teams can now monitor clicks, impressions, CTR, and average position with precision while remaining blind to a more important outcome: whether AI systems cite, summarize, or suppress the brand inside generated answers. A dashboard that can't measure machine-mediated visibility can't govern modern discovery.
Executive summary: Customizable SEO dashboards must evolve from search reporting interfaces into unified visibility systems that track both traditional SEO performance and Generative Engine Optimization performance. The winning model doesn't replace classic metrics. It reorders them around a broader control problem: how a brand becomes discoverable, retrievable, and recommendable across both search engines and LLM interfaces.
Table of Contents
From Reporting Vanity to Engineering Visibility
The old dashboard solved fragmentation, not visibility
AI discovery changes the object being measured
Why Traditional SEO Dashboards Are Obsolete
Rank is no longer the only unit of visibility
Algomizer Evidence Clusters replace isolated keyword logic
Semantic Density determines whether a source survives synthesis
The Unified GEO Measurement Framework
The Algomizer Visibility Spectrum organizes modern measurement
Traditional SEO KPIs and GEO KPIs answer different questions
Headless collection closes the measurement gap
Building Your Unified Visibility Dashboard
Connection order determines data integrity
A three-level layout keeps the dashboard usable
Filters should reflect real operating decisions
Activating Your Dashboard with Automation and Governance
Automation determines whether measurement changes outcomes
Governance is a measurement discipline, not an approval process
Conclusion The Dashboard as a Control System
Measurement now governs machine visibility
The strategic advantage is interpretability
From Reporting Vanity to Engineering Visibility
The old dashboard solved fragmentation, not visibility
Customizable SEO dashboards emerged because search measurement became too complex for spreadsheets and static reports. A modern dashboard typically centralizes data from Google Search Console, Google Analytics 4, and third-party tools such as Ahrefs or SEMrush into one interactive view, which eliminated constant report switching and made near-real-time monitoring standard, according to Data Bloo's guide to custom SEO dashboards.
That shift mattered. It made landing pages, keyword movement, technical issues, and conversion impact observable inside one operating layer. It also encouraged segmentation by brand versus non-brand, desktop versus mobile, page type, audience segment, and country or region, which is now essential for enterprise search programs.
But the standard dashboard still carries a legacy assumption. It treats search as a ranked-list environment where the primary task is measuring how often a URL appears and how often a user clicks.
That model breaks the moment an interface answers the question directly.
Practical rule: When the interface synthesizes instead of listing, the measured object changes from link performance to answer participation.
AI discovery changes the object being measured
Large language models and retrieval systems don't present visibility the same way Google's classic results do. They compress, rewrite, merge, and prioritize evidence. A brand can influence the answer materially and still generate no click. It can also lose answer presence while preserving strong page-level rankings.
That is why conventional scorecards are no longer enough on their own. Organic sessions, Search Console clicks, impressions, CTR, and average position still belong in the dashboard. They no longer define the full perimeter of discovery.
A modern enterprise dashboard must therefore answer two different questions at once:
Classic SEO question: Did the page earn search demand and convert it?
GEO question: Did the brand appear inside the generated answer, and how was it framed?
Executive question: Did both systems increase qualified visibility in ways the business can act on?
The strategic error is subtle. Teams believe they're measuring authority because the dashboard is advanced. In practice, they're measuring only the visible residue of one interface.
The superior approach is to unify ranked-search telemetry with AI-answer telemetry inside a single framework. That turns customizable SEO dashboards from retrospective reporting tools into visibility engineering systems.
Why Traditional SEO Dashboards Are Obsolete
Rank is no longer the only unit of visibility
Traditional dashboards are obsolete because they overfit to rank-based interfaces. They still assume the key metric is where a URL appears inside a list. In a retrieval-and-generation environment, the decisive event is whether a source is selected, interpreted, and surfaced inside the answer itself.
This is exactly why modern dashboard guidance has moved away from vanity metrics and toward business-linked measurement. Proxy metrics such as traffic, impressions, and rankings must connect to conversions, revenue, and retention, and teams increasingly use alerts, weekly reviews, and SLA-backed thresholds so dashboards function as operational systems rather than passive reports, as described in Improvado's Looker Studio SEO dashboard analysis.
That evolution is important, but it still leaves a blind spot. A dashboard can connect rankings to revenue and still fail to measure whether the brand is present in ChatGPT, Gemini, Claude, or Perplexity responses.
A ranking report describes placement. An AI visibility report must describe selection.
Algomizer Evidence Clusters replace isolated keyword logic
The most useful replacement unit is the Evidence Cluster. An Evidence Cluster is the set of pages, entities, claims, citations, supporting documents, and recurring semantic patterns that an LLM can draw on when generating an answer for a topic.
This changes dashboard design immediately.
Instead of tracking only one query to one landing page, teams should evaluate whether a topic cluster produces the kinds of retrievable evidence a model can trust and reuse. A page can rank well for a phrase and still fail to contribute to the answer if the surrounding evidence is thin, inconsistent, or weakly structured.
A practical AI-first dashboard therefore tracks visibility around clusters such as:
Legacy unit | AI-era unit | Why it matters |
|---|---|---|
Single keyword | Evidence Cluster | LLMs synthesize across related material, not one exact phrase |
Individual URL | Topic entity set | Retrieval often favors entity-rich, corroborated context |
Average position | Answer participation | Users increasingly consume the synthesis, not the ranked list |
Teams that need answer-level monitoring should also pair classic SEO reporting with an AI answer rank tracker so they can observe how generated interfaces represent the brand.
Semantic Density determines whether a source survives synthesis
The second missing metric is Semantic Density. This is the concentration of clear, machine-legible meaning inside a page or topic set. It reflects whether a system can reliably infer what the brand does, what claims are supported, which entities are connected, and why the source should be cited.
Semantic Density is a measurement concept for dashboard design. It becomes visible through patterns such as repeated citation, answer inclusion, stable topic association, and favorable answer framing across prompts and platforms.
A source that ranks but doesn't survive synthesis has search presence without retrieval authority.
This is the authority paradox that breaks old reporting logic. A strong traditional authority signal doesn't guarantee answer visibility. A weaker conventional profile can outperform in AI systems if its evidence is clearer, more structured, and easier to synthesize.
That is why average position becomes insufficient as a governing KPI. It still matters. It no longer explains the full path from discovery to recommendation.
The Unified GEO Measurement Framework
The Algomizer Visibility Spectrum organizes modern measurement
The correct framework is a two-sided one. Traditional SEO and Generative Engine Optimization are not competing reporting systems. They are different observational layers of the same visibility problem.
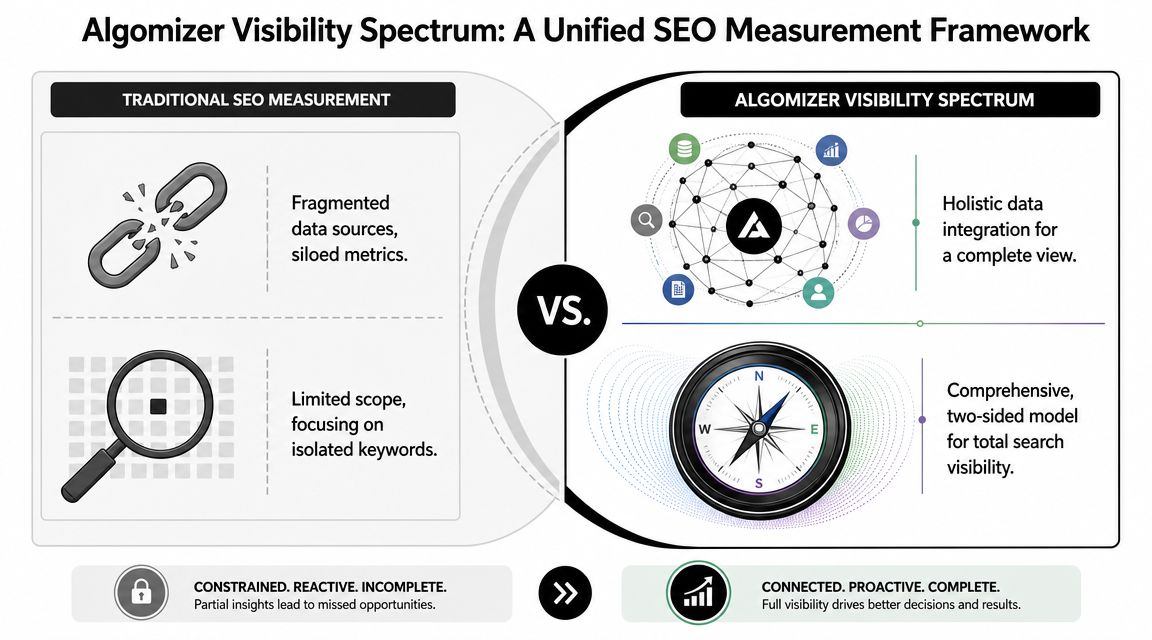
The Algomizer Visibility Spectrum organizes this by separating metrics into two interacting surfaces:
Legacy SEO visibility, which captures crawlability, indexation, ranking, click behavior, engagement, and conversion.
GEO visibility, which captures whether AI systems retrieve, cite, frame, and recommend the brand inside synthesized responses.
The model is superior because it respects how LLMs function. Search engines index pages and rank documents. LLM systems retrieve evidence, compress context, and generate language. One system rewards prominence in listings. The other rewards retrievability inside synthesis.
Teams that want the technical theory behind this shift can review the technical framework for GEO.
Traditional SEO KPIs and GEO KPIs answer different questions
Both metric families belong in one dashboard, but they serve different decisions.
Measurement Area | Traditional SEO KPI | Generative Engine Optimization (GEO) KPI |
|---|---|---|
Demand capture | Organic sessions | Citation frequency in AI answers |
Search result visibility | Search Console clicks | Share of answer presence |
Result attractiveness | CTR | Answer sentiment or framing |
Ranking state | Average position | Entity prominence in answer composition |
Page performance | Conversions from organic landing pages | Topic-level inclusion across AI systems |
Technical health | Core Web Vitals and mobile usability indicators | Retrieval consistency across prompt variants |
The key insight is that GEO metrics don't replace revenue-linked SEO metrics. They explain what classic dashboards miss before the click ever exists.
A page with strong impressions and weak conversions may need CRO work. A topic with strong rankings and weak AI citation may need evidence restructuring, entity reinforcement, and machine-readable support. These are different problems. A unified dashboard stops teams from treating them as one.
Headless collection closes the measurement gap
Standard analytics tools do not fully capture what happens inside answer interfaces. Platforms such as Gemini and Perplexity may expose limited public telemetry for answer presence, citation placement, or framing. That creates a structural measurement gap.
A workable GEO layer therefore uses headless browser automation to observe the interface directly, record answer composition, and classify whether a brand appears as a citation, a named recommendation, a comparison target, or an omitted source. This is the only reliable way to measure non-API answer environments consistently across systems.
Operating principle: If the interface is visual and generated, the measurement method must observe the interface itself.
That collection stream then enters the same BI environment as Search Console and GA4. Once unified, the dashboard can compare classic and generative visibility around the same page, topic, market, and entity set.
Building Your Unified Visibility Dashboard
Connection order determines data integrity
Dashboard quality is set at the model layer. If page keys, dates, and market definitions do not align before visualization, every chart built on top of them becomes harder to trust.
For that reason, a unified visibility dashboard should be assembled in a strict sequence. Search Console establishes search demand and page-query relationships. GA4 adds sessions and conversion outcomes. Only then should teams normalize dimensions such as page path, country, device, and reporting window. Keywordme's guidance on customizable SEO dashboards supports this build discipline, and the logic becomes stronger once GEO measurement enters the stack.
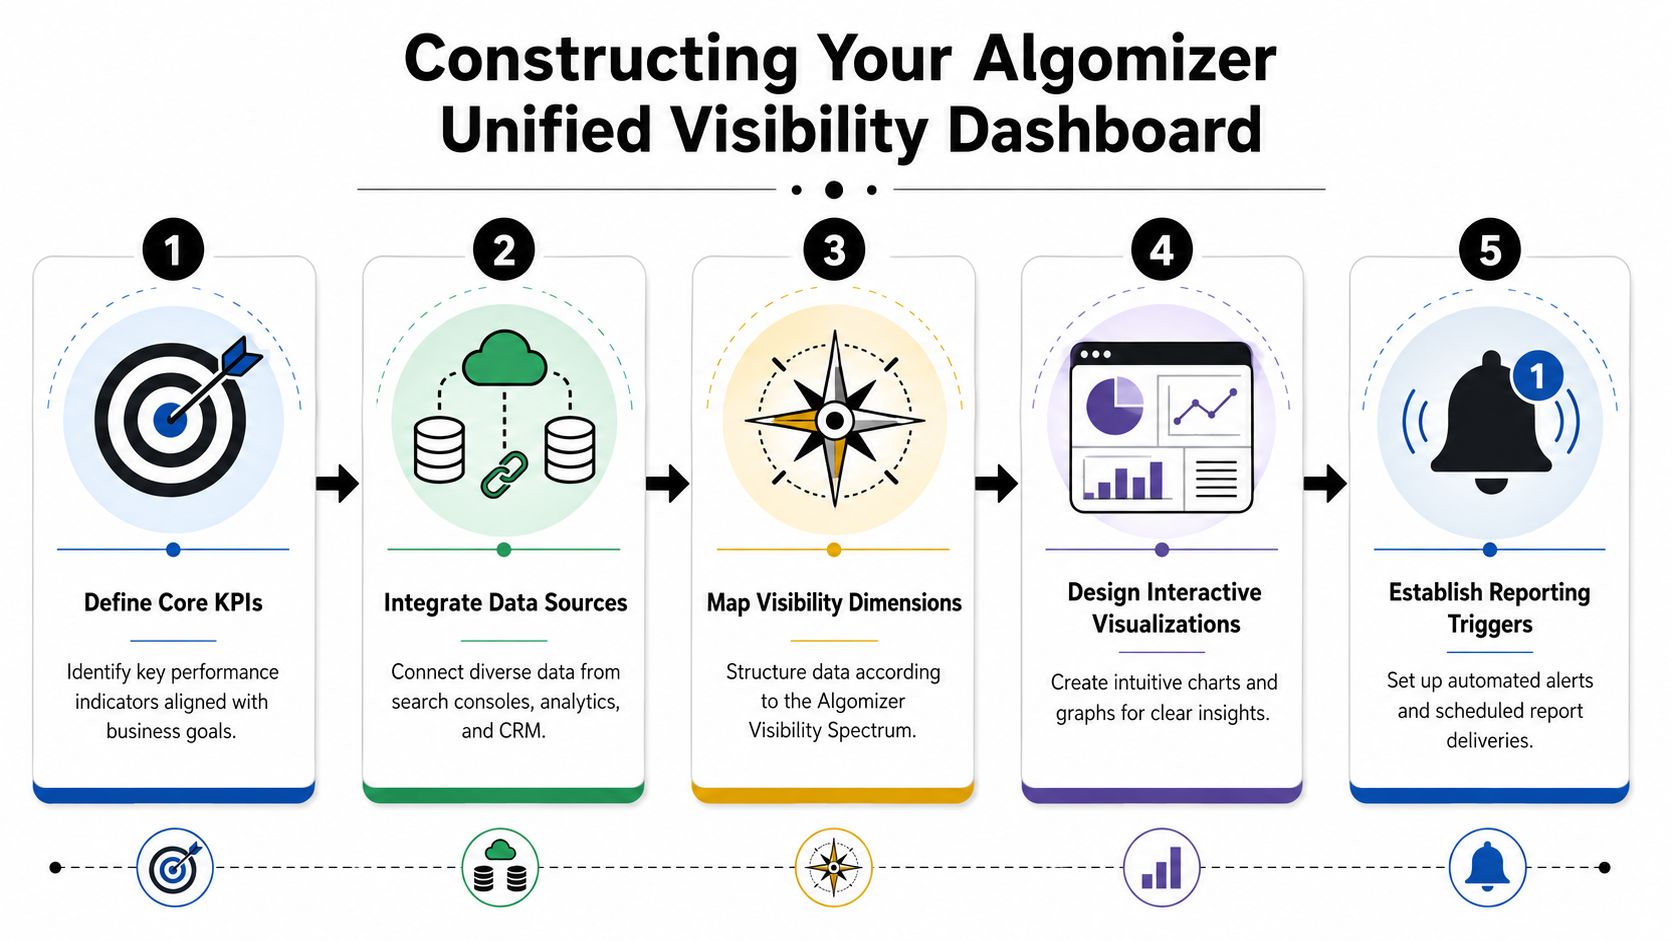
The order should look like this:
Search Console first: Create the baseline for clicks, impressions, CTR, average position, and query-page mapping.
GA4 second: Attach business outcomes such as engaged sessions, conversions, and landing-page value.
Dimension alignment third: Standardize URLs, dates, market labels, and content groupings before any blend.
GEO stream fourth: Add answer-level observations against the same page, topic, entity, and market taxonomy.
BI model last: Build scorecards, trend views, and investigation tables only after the schema is stable.
This sequence does more than reduce cleanup. It creates a common measurement spine for two visibility systems that behave differently. Traditional SEO produces clickstream evidence. GEO often produces answer presence without a click. A shared schema is what lets an enterprise team compare them without forcing one model onto the other.
Early dashboard design should stay conservative. Mixed-axis charts and decorative composites often conceal broken joins, duplicate rows, or mismatched date logic. Analysts need clean tables before leadership gets polished scorecards.
A three-level layout keeps the dashboard usable
Usability depends on compression. Executives need a fast status read. Channel owners need trend context. Analysts need row-level evidence.
A three-level layout handles those jobs without turning the dashboard into a cluttered reporting surface:
Dashboard Level | What belongs there | Why it works |
|---|---|---|
Level 1 | Headline scorecards such as organic conversions, Search Console clicks, and total AI citations | Gives leadership an immediate status read |
Level 2 | Trend charts for SEO and GEO over time | Shows whether visibility systems are moving together or diverging |
Level 3 | Deep-dive tables by page, topic, device, market, and AI platform | Lets analysts isolate the cause of change |
The Level 1 mistake is overpopulation. Start with a small set of indicators that represent demand, traffic, business outcome, and AI presence. For most enterprise teams, that means organic sessions, clicks, conversions, and AI citations or answer presence. If the top row contains fifteen KPIs, none of them governs action.
Level 2 is where the unified model becomes strategically useful. Trend views should do more than place SEO and GEO lines beside each other. They should reveal disagreement between systems. A topic can gain rankings while losing citation share in generative answers. Another can hold traffic steady while gaining AI recommendation frequency. Those are different operating conditions, and the dashboard should make them visible without forcing an analyst into a custom report.
Level 3 houses the working tables, which provide significant diagnostic value. Segment by page cluster, topic group, brand versus non-brand, device, market, and platform. Enterprise teams need this layer to answer a harder question than "what changed?" They need to answer "which visibility mechanism changed, for which asset class, in which market, and with what commercial consequence?"
A short implementation demo can help teams visualize the build sequence.
Filters should reflect real operating decisions
Filters should mirror ownership and budget decisions, not default fields from source platforms.
The most useful controls usually include:
Brand versus non-brand: Separates demand capture from demand creation.
Device: Exposes differences in mobile behavior, rendering performance, and answer consumption patterns.
Page type: Distinguishes blog, product, category, documentation, and solution pages, which perform differently in both search and generative retrieval.
Country or region: Captures localization effects in ranking, citation patterns, and source preference.
Topic cluster: Creates the common analytical unit across classic SEO and GEO.
Topic cluster is often the most important filter in the entire build. URL-level reporting is too narrow for executive decision-making, while domain-level reporting is too broad for action. Topic clusters create the middle layer where content strategy, technical structure, and AI visibility can be evaluated together.
When these controls are aligned across Search Console, GA4, and GEO observation data, the dashboard changes function. It stops acting like a reporting artifact and starts operating as a visibility control system.
Activating Your Dashboard with Automation and Governance
Automation determines whether measurement changes outcomes
An enterprise dashboard becomes operational only when it converts visibility signals into assigned actions with defined thresholds. That standard now has to cover two systems at once. Ranked search and generated answers behave differently, but both require the same management discipline: detect change early, route it to the correct owner, and verify whether the response improved business performance.
Siteimprove's technical SEO dashboard guidance supports this operating model by tying dashboard review to validation methods such as holdout pages, segmentation, and trend analysis rather than simple before-and-after comparisons.
The practical implication is clear. Alerting should reflect the measurement architecture of the unified visibility program, not the reporting defaults of SEO tools.
A useful enterprise design separates alerts into two classes:
Tier 1, SEO reliability alerts: clicks decline on priority clusters, conversion-producing landing pages lose traffic, Core Web Vitals deteriorate, indexation drops, or crawl patterns change in ways that threaten discoverability.
Tier 2, GEO visibility alerts: answer presence falls for a target topic, citation frequency weakens, model coverage shifts across platforms, or brand framing becomes less favorable in generated responses.
This distinction matters because the remediation path is different. Tier 1 alerts usually indicate a ranking, technical, or site experience problem. Tier 2 alerts often point to weak source formatting, insufficient entity support, citation displacement, or prompt-dependent volatility. Combining them in one alert queue slows response and obscures ownership.
Many enterprise teams still stop at observation. They review trends each week, but they never define what magnitude of loss requires intervention, who responds first, or how long the team has to contain the issue. In practice, that means the dashboard records deterioration without governing it.
Governance is a measurement discipline, not an approval process
False attribution is the main governance failure in both SEO and GEO. A visibility increase after a content release does not prove causation. Search demand may have shifted. Device mix may have changed. An LLM provider may have altered retrieval behavior, prompt interpretation, or source selection at the same time.
The dashboard should therefore support a simple governance model built around review cadence and decision rights:
Role | Review cadence | Primary concern |
|---|---|---|
Analyst | Weekly | Data quality, anomaly triage, threshold integrity |
Strategist | Weekly and monthly | Experiment design, topic prioritization, corrective action |
Executive | Monthly | Direction of visibility, impact on pipeline, resource allocation |
This model works because it limits each role to the decisions that role can improve. Analysts maintain signal quality. Strategists decide whether the problem is technical, editorial, or competitive. Executives intervene only when the pattern affects investment, priorities, or risk.
Standardized escalation matters even more in multi-brand, multi-market, and agency environments. If answer presence drops for a strategic topic in one region but rankings remain stable, the issue should route to the team responsible for machine-readable evidence and source reinforcement, not disappear inside a general SEO review. Organizations that need consistent oversight across business units can use patterns from enterprise agency rank tracking workflows to define comparable thresholds, ownership rules, and escalation paths across markets.
The broader point is strategic. Traditional dashboards were built to summarize channel performance. A unified SEO and GEO dashboard has a different job. It governs how the organization detects, validates, and corrects losses in machine visibility before those losses appear in pipeline or revenue.
Conclusion The Dashboard as a Control System
Measurement now governs machine visibility
The enterprise dashboard has crossed an architectural boundary. It is no longer a reporting surface that describes what happened in Google. It is now the control system that determines whether the brand is visible across both ranked search and generated answers.
That changes how leadership should evaluate customizable SEO dashboards. The question is whether the system measures the full path from crawlability and indexation to answer inclusion and conversion impact.
Classic SEO metrics still matter because they describe discoverability in the indexed web. GEO metrics now matter because they describe retrievability in machine-generated interfaces. The modern search program needs both.
The strategic advantage is interpretability
The deeper shift is strategic, not cosmetic. LLM systems don't merely rank information. They interpret it. That means the winning brand is not solely the one with more pages or more keyword coverage. It is the one whose evidence can be retrieved, trusted, compressed, and repeated accurately.
A unified dashboard is the instrument that makes that process governable.
It lets teams see when a topic performs well in Search Console but disappears in generated answers. It exposes when technical health is strong but machine framing is weak. It shows when content attracts visibility but fails to survive synthesis. Most important, it enables controlled intervention. Teams can modify structure, support claims, improve entity clarity, and then observe whether both humans and machines respond.
That is the new measurement standard. Visibility is no longer just a ranking outcome. It is an engineered state across search engines, answer engines, and AI-mediated discovery systems.
Algomizer helps brands measure and improve visibility inside AI-generated answers across ChatGPT, Claude, Gemini, Perplexity, and other platforms. Teams that need a unified view of SEO and GEO performance can book a call with Algomizer to discuss a visibility assessment, answer-level tracking, and an enterprise-ready measurement system.